Mapping Global Banking Networks in the Early Twentieth Century: Banks with Correspondent Connections to London (1901-1913)

Hafiza is a current master's student pursuing a degree in Economics and Policy at King's College London. Prior to this, she completed a bachelor's degree in Economics with Econometrics at Goldsmiths, University of London. Her journey towards postgraduate studies was greatly influenced by the UNIQ+ programme, which provided her with a profound understanding of academic research and helped her to acquire invaluable research skills. Hafiza’s primary academic interests revolve around macroeconomic policy, but she also has a keen interest for economic history. In addition to her studies, Hafiza is actively involved as a research assistant at the Policy Institute, King's College London.
Since the late nineteenth century, correspondent banking has played a fundamental role in the global financial system, influencing the expansion of international relationships and commerce. The significance of global correspondent banking is rooted in its proficiency to expedite international trade and financial transactions by providing essential financial services that establish long-term connections between banks in different countries. The correspondent banking system has progressively evolved throughout history into the quintessential mechanism for advancing long-distance payments (Kaimal & Sajoy, 2022).
This report aims to analyse the geographic distribution of countries with correspondent banking connections to London between 1901 and 1913 using data from The Bankers’ Almanac. The dataset, comprising approximately 140,000 entries, sheds light on the geographical distribution of banks and bank branches that maintained correspondent banking relationships with London.
Section 1 of this report examines the geographic distribution of banks with connections to London. Section 2 revises the growth in banks and branches in the period. Geographic divergences in the expansion of banks and bank branches at the country level are examined in Sections 3 and 4, followed by concluding remarks.
1. Geographic Distribution of Banks with Connections to London
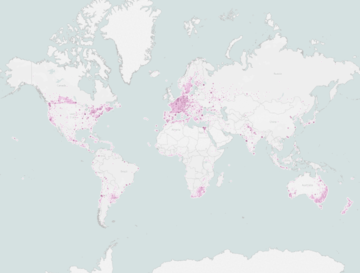
Map 1 shows the total number of banks connected to London from 1901 to 1913. Map 1 evidences a rapid increase in banks throughout the observed period. These distinct patterns in the distribution of banks across the regions exhibit the broader dynamics of economic development, representing disparate degrees of financial establishment and economic growth across several countries.
- Notably, countries such as France, Germany, and Italy prominently stand out as highly concentrated hubs with the highest density of banks. The high density of banks in Western European nations indicates their critical role as financial hubs in the global payments system, inviting domestic and international demand.
- European offshoots (“new Europes”), such as the United States, Australia, New Zealand, and Canada, also had a high density of banks due to their rapid industrialisation, growing external sectors, and integration into global financial markets.
- Banks in peripheral countries with banking density, including Mexico, Argentina, and South Africa, established links to London due to higher integration into the global economy.
- Peripheral countries with fewer banks, such as Libya, Bulgaria, and West Africa, emerge as regions with comparatively fewer banks, indicating a lower level of financial integration and a condensed dependence on foreign trade and capital flows. This may imply a need for additional development of their financial sectors to improve their connectivity to the global financial system.
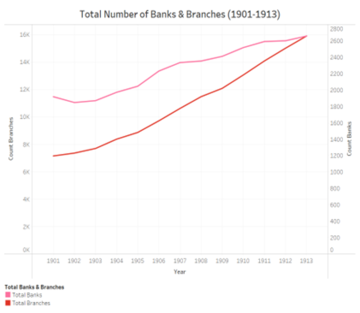
Graph 1. Total Number of Banks and Branches (1901-1913) Source: Dataset drawn from The Bankers’ Almanac, several years.
2. Banks and Branches
Graph 1 traces the evolution of banks and branches throughout the period spanning from 1901 to 1913. In 1901, there were 1,921 banks and 7,156 branches; by 1913, there were 2,656 unique banks and 15,905 branches, representing a 38% increase in banks and an 122.3% increase in branches. The substantial growth in the total number of banks exemplifies the robust economic development and expanding financial activities during this period. The quantity of banks increased, mirroring the cumulative demand for financial services and the overall economic prosperity of the global economy, respectively.
Harmoniously, this expansion is even more prominent in the number of branches, with a 122% increase in 1913 compared to 1901. This observation underlines a parallel pattern between the total number of banks and branches. The momentous growth in branches displays the correspondent banking industry’s potential to increase its scope and accessibility to the global economy. The rise in branches likely positively influenced some domestic communities, promoting higher access to banking services for individuals and businesses, which fostered local economic growth.
Overall, the analysis from Graph 1 reveals a significant transformation in global correspondent banking, with the number of banks and branches experiencing abundant growth from 1901 to 1913. This rise not only signifies economic growth but also underlines the role of correspondent banking in driving domestic development and the availability of financial services.
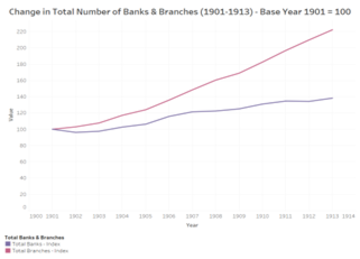
Graph 2. Total Number of Banks and Branches (1901-1913) – Base Year 1901 – 100. Source: Dataset drawn from The Bankers’ Almanac, several years.
Graph 2 shows the growth in the total number of banks and branches throughout the period spanning from 1901 to 1913, with a reference year of 1901. The trend offers a comprehensive perspective of how the correspondent banking sector progressed during this crucial period, showcasing a substantial growth in the total number of banks and branches that established connections in London.
The index value for the total banks and branches went from 100 in 1901 to 138 and 222, respectively, in 1913. These values demonstrate the momentous expansion experienced in the total number of banks and branches. As shown by the index values, the significant growth in both banks and branches underlines the banking sector’s magnitude in directing economic development and availability of financial services.
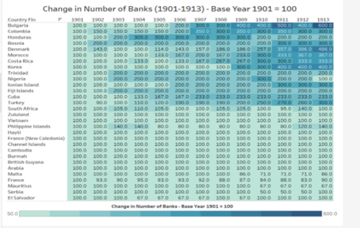
Chart 1. Change in Number of Banks (1901-1913) – Base Year 1901 = 100. Source: Dataset drawn from The Bankers’ Almanac, several years.
3. Banks
Chart 1 shows the geographic disparities in the number of banks connecting to London for the top 15 countries with the highest change in the number of banks and the bottom 15 countries with the lowest change, using a base year of 1901.
- The top 15 countries, such as Bulgaria, Colombia, and Honduras, had the highest increase in the number of banks due to intense integration into the global economy and financial development.
- The bottom 15 countries, including El Salvador, Serbia, and Mauritius, had the lowest change in the number of banks, reflecting a relatively stagnant banking environment within their borders on account of their less intense integration into global trade and finance.
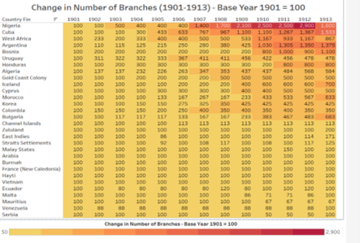
Chart 2. Change in Number of Branches (1901-1913) – Base Year 1901 = 100. Source: Dataset drawn from The Bankers’ Almanac, several years.
4. Branches
Chart 2 shows the geographic variation in the number of bank branches for the top 15 countries that experienced the highest shifts in the number of branches and the bottom 15 countries with the lowest change, employing 1901 as the base year of 1901.
- The top 15 countries, such as Nigeria, Cuba, and West Africa, stand out with the most substantial increases in the number of branches, shedding light on how their banking sectors developed in the first economic globalisation (1870-1914).
- The bottom 15 countries, including Serbia, Venezuela, and Mauritius, had the lowest changes in the number of branches, insinuating an absence of economic growth or integration into the global economy.
The increases in the number of banks (Chart 1) and bank branches (Chart 2) evidence a remarkable but uneven expansion of the global banking industry in the 1901-1913 period, mirroring the evolution of the world economy.
Conclusions
The analysis above revealed the changing structure of correspondent banking in this period, reflecting different economic and banking development patterns. The rise in total banks with connections to London and branches points to a global expansion in the provision and demand for financial services with geographic disparities.
- Per Figure 1, France, Germany, and Italy had the highest number of banks with connections to London, evidencing their central location in the global financial system.
- Per Chart 1, Bulgaria, Columbia, and Honduras experienced the highest increase in the number of banks, suggesting their domestic banking systems expanded rapidly.
- Per Chart 2, Nigeria, Cuba, and West Africa experienced the highest rise in the number of branches, indicating that branch banking grew vigorously in these countries.
References
Manju Kaimal, and P.B. Sajoy. “SWIFTNet and Correspondent Banking: An Introductory Analysis to the Use of ICT by the International Financial System,” in March Through Search. A Multidisciplinary Research Book, Sudipta Ghosh, Suryatapa Das (eds.) Kolkata: Rohini Nandan, 2021, 130-144.


